
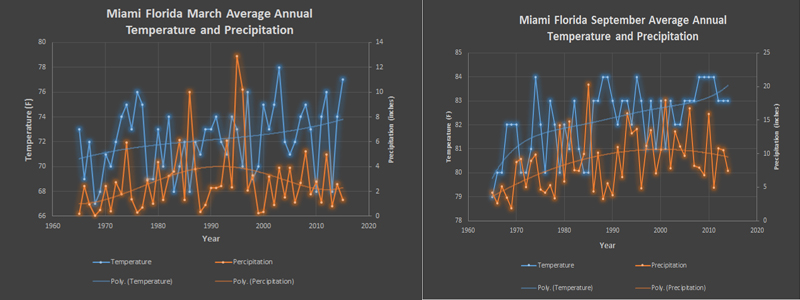
Average Annual Temperatures and Precipitation for the Months of
March and September for Miami, Florida, USA
Date |
Miami Florida March |
Miami Florida September |
||
Temperature |
Precipitation |
Temperature |
Precipitation |
|
1965 |
73 |
0.19 |
79 |
4.21 |
1966 |
69 |
2.44 |
80 |
2.57 |
1967 |
72 |
0.97 |
80 |
5.14 |
1968 |
67 |
0.07 |
82 |
3.41 |
1969 |
68 |
0.52 |
82 |
1.82 |
1970 |
71 |
2.42 |
82 |
8.79 |
1971 |
70 |
0.4 |
80 |
9.19 |
1972 |
72 |
2.76 |
80 |
5 |
1973 |
74 |
1.76 |
81 |
8.9 |
1974 |
75 |
5.94 |
84 |
9.84 |
1975 |
73 |
1.36 |
82 |
4.67 |
1976 |
76 |
0.3 |
80 |
4.2 |
1977 |
75 |
0.69 |
83 |
5.34 |
1978 |
69 |
2.91 |
82 |
3.37 |
1979 |
69 |
1.03 |
80 |
14.2 |
1980 |
73 |
4.38 |
82 |
5.82 |
1981 |
70 |
1.32 |
81 |
14.77 |
1982 |
74 |
3.25 |
83 |
7.53 |
1983 |
68 |
3.6 |
81 |
7.47 |
1984 |
70 |
6.12 |
80 |
10 |
1985 |
72 |
1.33 |
80 |
20.32 |
1986 |
68 |
10 |
83 |
4.34 |
1987 |
72 |
3.81 |
83 |
10.15 |
1988 |
71 |
0.36 |
84 |
3.3 |
1989 |
73 |
0.89 |
84 |
5.59 |
1990 |
73 |
2.28 |
83 |
3.86 |
1991 |
74 |
2.26 |
82 |
10.94 |
1992 |
72 |
2.46 |
83 |
6.47 |
1993 |
71 |
6.09 |
83 |
15.98 |
1994 |
74 |
2.34 |
82 |
12.99 |
1995 |
73 |
12.92 |
84 |
13.7 |
1996 |
70 |
10.19 |
83 |
4.85 |
1997 |
76 |
2.08 |
81 |
11.13 |
1998 |
69 |
3.29 |
83 |
13.53 |
1999 |
70 |
0.25 |
81 |
7.03 |
2000 |
75 |
0.35 |
83 |
10.58 |
2001 |
73 |
3.21 |
81 |
17.95 |
2002 |
75 |
0.89 |
83 |
7.83 |
2003 |
78 |
3.89 |
82 |
13.32 |
2004 |
72 |
1.51 |
82 |
11.05 |
2005 |
71 |
3.9 |
83 |
9.71 |
2006 |
72 |
1.1 |
83 |
16.76 |
2007 |
74 |
2.68 |
83 |
8.22 |
2008 |
75 |
5.24 |
84 |
7.87 |
2009 |
73 |
1.78 |
84 |
6.83 |
2010 |
68 |
2.81 |
84 |
15.89 |
2011 |
74 |
1.13 |
84 |
4.95 |
2012 |
76 |
4.97 |
83 |
10.77 |
2013 |
68 |
0.81 |
83 |
10.47 |
2014 |
74 |
2.61 |
83 |
7.43 |
2015 |
77 |
1.32 |
||
Mean monthly temperatures and precipitation for the months of March and September
from 1965 to 2015 for Miami, Florida. Data taken from wunderground.com
Mean temperature and precipitation from 1965 to 2015 of Miami, Florida for the months of March and September. Data was collected and compiled from wunderground.com.
from 1965 to 2015 for Miami, Florida. Data taken from wunderground.com
Mean temperature and precipitation from 1965 to 2015 of Miami, Florida for the months of March and September. Data was collected and compiled from wunderground.com.
Data collected from the weather underground.
References:
wunderground.com, 2015, Weather Underground Historical Miami Florida
Copyright © 2015-2022 averageglobaltemperature.com. All Rights Reserved.