
Average Annual Temperatures and Precipitation for the Months of
March and September for Anchorage, Alaska, USA
Year |
Avg Temp March |
Avg Prec March |
Avg Temp Sept |
Avg Prec Sept |
1976 |
35 |
0.01* |
48 |
0* |
1977 |
34 |
0* |
50 |
0* |
1978 |
34 |
0* |
50 |
0* |
1979 |
30 |
0.08* |
52 |
0.38* |
1980 |
28 |
0* |
47 |
0* |
1981 |
35 |
0* |
49 |
0* |
1982 |
27 |
0* |
49 |
0* |
1983 |
30 |
0* |
46 |
0* |
1984 |
34 |
0* |
50 |
0* |
1985 |
27 |
0* |
49 |
0* |
1986 |
23 |
0* |
49 |
0* |
1987 |
27 |
0* |
48 |
0* |
1988 |
32 |
0* |
49 |
0* |
1989 |
24 |
0* |
51 |
0* |
1990 |
30 |
0* |
50 |
0* |
1991 |
25 |
0* |
50 |
0* |
1992 |
26 |
0* |
41 |
0* |
1993 |
29 |
0* |
49 |
0* |
1994 |
25 |
0* |
50 |
0* |
1995 |
19 |
0* |
53 |
0* |
1996 |
27 |
0* |
47 |
0* |
1997 |
24 |
0 |
52 |
0 |
1998 |
29 |
0.05 |
50 |
0.9 |
1999 |
24 |
0.89 |
50 |
3.43 |
2000 |
30 |
0.92 |
48 |
2.71 |
2001 |
30 |
0.89 |
50 |
1.36 |
2002 |
21 |
1.4 |
50 |
3.61 |
2003 |
27 |
0.38 |
48 |
2.63 |
2004 |
25 |
0.6 |
45 |
5.91 |
2005 |
32 |
1.33 |
52 |
4.36 |
2006 |
23 |
0.84 |
50 |
3.43 |
2007 |
13 |
0.1 |
51 |
4.16 |
2008 |
31 |
0.15 |
49 |
2.88 |
2009 |
22 |
0.58 |
50 |
1.11 |
2010 |
27 |
0.42 |
50 |
0.68 |
2011 |
27 |
0.29 |
50 |
0.28 |
2012 |
19 |
0.27 |
49 |
6.05 |
2013 |
24 |
0.77 |
49 |
5.67 |
2014 |
26 |
0.72 |
51 |
3.03 |
2015 |
30 |
0.22 |
Data collected from wunderground.com *Note precipitation data questionable prior to 1999 due to zero values.
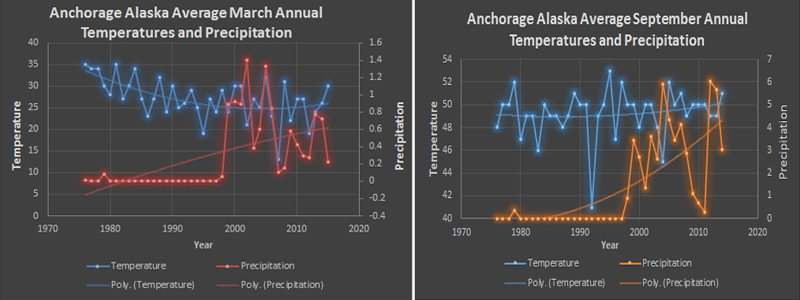
Mean temperatures and precipitations plotted on graphs for Anchorage, Alaska for the months of March and September from 1976 to 2015. * Precipitation values prior to 1996 are questionable. Data is collected and compiled from wunderground.com.
Data collected from the weather underground.
References:
wunderground.com, 2015, Weather Underground Historical Anchorage Alaska
Copyright © 2015-2022 averageglobaltemperature.com. All Rights Reserved.