
Climate Change Man Made or Not?
The climate is always changing and always has. The question is, are recent changes caused by humans emissions of CO2, methane, etc. Below are some charts that have been developed by others and by us to help determine if there is a correlation between climate change and mankind. Models being developed have to take into consideration all sorts of factors. There are an infinite amount of factors (global wobbling, solor maximum vs. solor minimum, volcanic eruptions, greenhouse gasses, etc.), affecting climate change on earth and no model would be able to consider all of them. However, there may be some factors affecting climate change that have an overwelming affect and should be weighted accordingly when creating climate change models. Determining those and implementing them in the models would be of upmost importance. Some factors influence other factors and can cause either negative or positive feedback loops. An example of a positive feedback loop is if the earth was warming, and glaciers melted a loss of the albieto affect from suns rays not being reflected by the bright glaciers more ultraviolet rays may be absorbed into the ocean causing a further heating of the earth. A negative feedback to global warming is, if raised CO2 levels were causing global warming then vegetation growth may be enhanced since plant life on land and in the ocean thrive on CO2 for survival a greater vegetation production may absorb more CO2 and offset global warming by removing CO2 from the atmosphere and water.
In simple terms it is necessary to understand the scientific logic which believes global warming is caused by rising CO2 levels in the atmosphere. Much of the sun's rays are short wave ultra violet radiation which can pass through the green house gases (CO2, Methane, etc.) reaching the earth. This warms the planet earth which then give off longer waved infrared radiation. However these infrared waves may be less likey to pass through the green house gases and return and further heat the earth. In a nutshell, this is the basic scientific interpretation and cause of our current global warming from certain gases such as carbon dioxide and methane. (Woodford, 2014)
Over the last 450 thousand years there have been about 5 or 6 major ice ages and or periods of interglacial periods with minor fluctuations between them as shown as seen in the fig. 1 below. The minor fluctuations last approximately 12,000 years. We have been in an interglacial period for about 11,000 years (Wikipedia, 2015). Over the past million years as earth moved out of major ice ages the earth would warm about 4 to 7 degrees celsius over 5,000 years. Over the past century the average global temperature has rose about .7 degrees celsius, which is about 10 times faster than normal (nasa.gov, 2015).
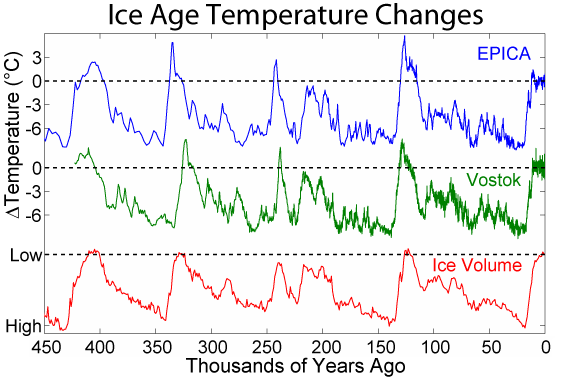
Fig. 1 - Ice age temperature changes over 450 thousand years.
Sunspot numbers and average global temperature change. Sunspots correspond to temporary dark spots on the sun and correlate to magnetic field flux which inhibit convection and reduce temperature to the surrounding photosphere. The number of sunspots usually follow an 11 year solar cycle. Solar flares and coronal mass ejections originate and are usually seen near sunspots. The highest point of number of sunspots is known as the solar maximum (Wikipedia, 2015). Generally, the variation of solar radiation is relatively small from the sunspots.
Fig. 2 - Daily sunspot numbers 1880 to 2015 (modified from spaceweather.com, 2015)
We can compare that to average annual global temperature and see if there is a corresponding trend modelers could incorporate into their models. Below is a graph/chart (Fig. 3) of global mean temperature over land and ocean.
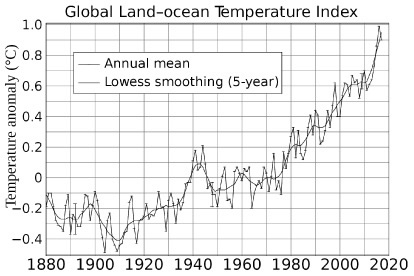
Fig. 3 - Global mean temperature over land and ocean. (By NASA Goddard Institute for Space Studies - http://data.giss.nasa.gov/gistemp/graphs/, Public Domain, https://commons.wikimedia.org/w/index.php?curid=24363898)
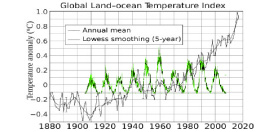
Fig. 4 - Overlay of sunspot number over global average temperature from 1905 to 2010.(modified from spaceweather.com, 2015and NASA Goddard Institute for Space Studies)
When comparing sunspot numbers and global average temperatue as in Fig. 4 above there does not seem to be a strong correlation between the two.
Next we can look at CO2 levels in the atmosphere from 1965 to 2020. Since 1960, CO2 levels have been measured at Mauna Loa, Hawaii. Notice the saw pattern in the chart below of the levels of CO2 in the atmosphere. That is from the different times of the season with summer months having greater growth of vegetation consuming some of the CO2 in the atmosphere (Harris, 2013).
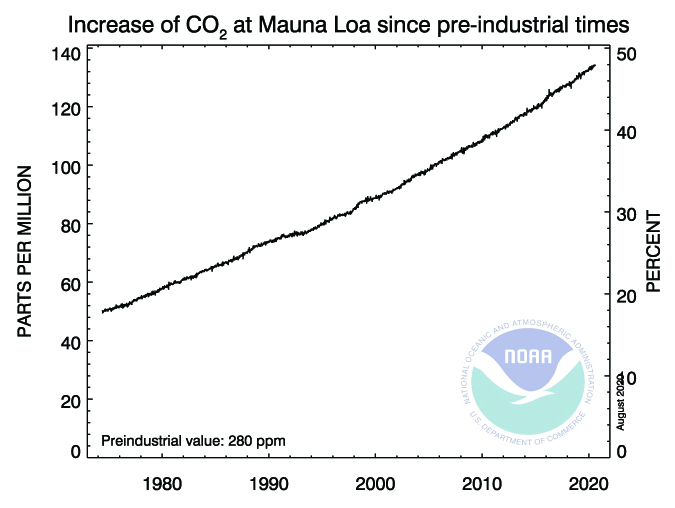
Fig. 5 - CO2 Levels from Mauna Loa, Hawaii
When comparing the mean global temperature and the Mauna Loa CO2 in the atmosphere there does seem to be a strong correlation between them. See Fig. 6 below.
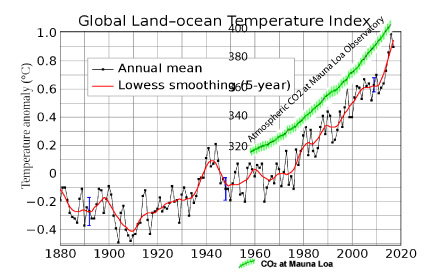
Fig. 6 - of mean global temperature and CO2 levels at Mauna Loa
The global temperature seems to be following the growth in CO2 in the atmosphere from 1960 to 2017 global temperatures have leveled off compared to the continued CO2 growth. If there is a correlation between CO2 and global mean temperature then their needs to be a logical explanation, and will future years temperatures continue to follow CO2 levels in the atmosphere.
Population and emmisions as well as concentrations have been growing at least since 1860 and are projected to continue as shown in figures below.
Below are figures showing population growth (Fig. 7) and emmisions of CO2 (Fig. 8).
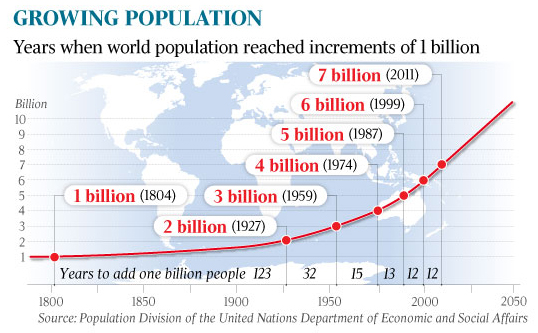
Fig. 7 - Global growth from 1800 to 2011
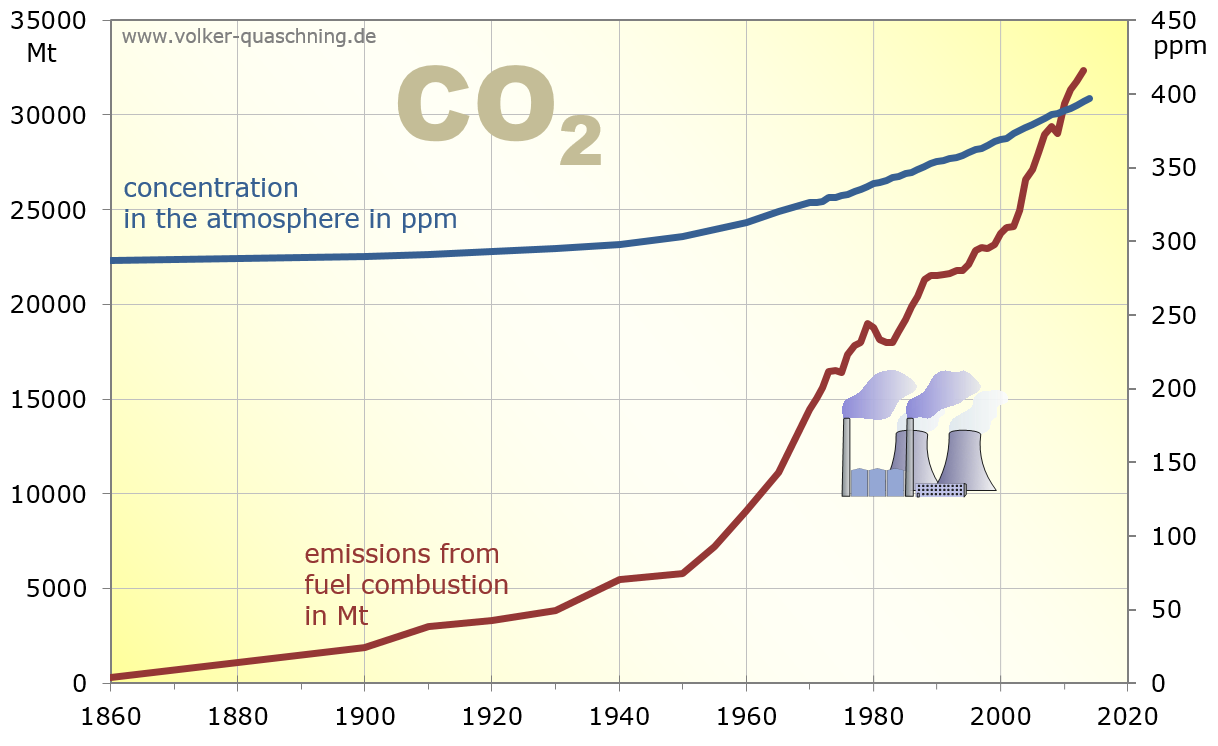
Fig. 8 - Growth of CO2 emissions and concentrations in atmosphere. (Volker-Quaschning.de, 2015)
According to oxygen isotopes in ice cores from the Vostock station in Antarctica it appears that there is a good correlation between CO2 and temperature over the last 420,000 years (Fig. 9) and a good correlation between CO2, temperature and sea level over the last 140,000 years.
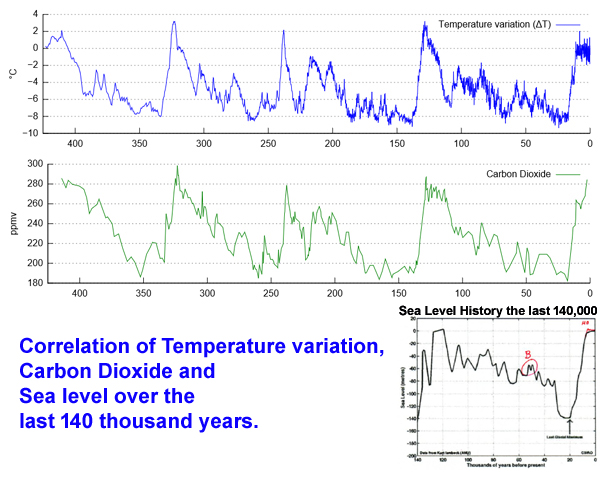
Fig. 9 - Corelation between CO2 levels, temperature and sea level.
(Wikipedia modified from Vostock Station, 2015 and Lambeck, 2004)
Cumulative sea level change vs. CO2 at Mauna Loa, Hawaii do seem to show a correlation from 1960 to 2015 as shown in
Fig. 10.
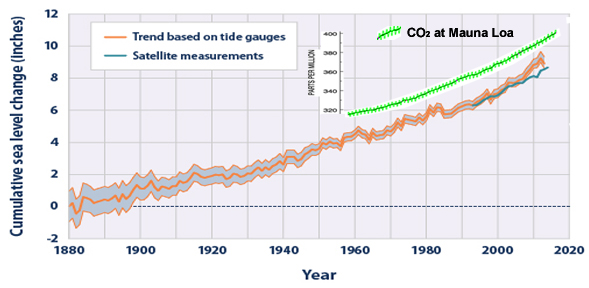
Fig. 10 Comparison of sea level rise to CO2 levels at Mauno Loa from 1960 to 2015. (Modified from
NOAA and EPA.gov, 2015)
However, interesting enough, when looking at global sea level rise vs. local sea leve rise there is not a clear correleation (Fig. 11) from 1960 to 2014. Some parts of the United states have seen sea level rise while others have seen sea level fall.
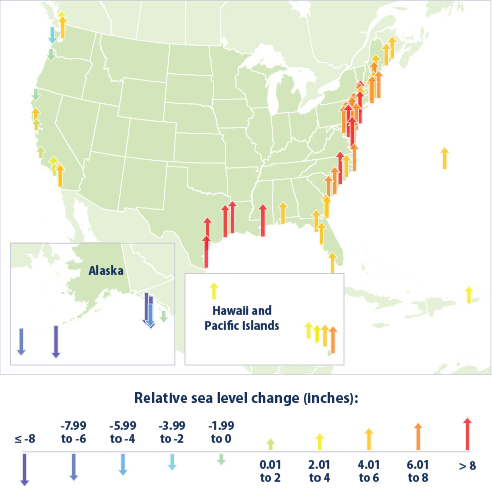
Fig. 11 - Map of local sea level rise and sea level fall. ( EPA.gov, 2015)
To attempt to understand the local differences between locations of sea level rise vs. sea level fall we have taken temperature and precipitation data for the locations of Anchorage, Alaska and Miami, Florida for comparison purposes from wunderground.com. (Fig. 11 & Fig. 12)
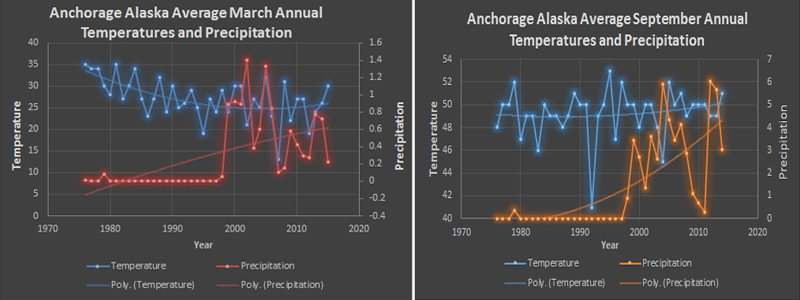
Fig. 12 - Anchorage, Alaska, average March and September temperature and precipitation from 1976 to 2015 . *Note precipitation values from 1976 to 1999 are questionable due to zero values.
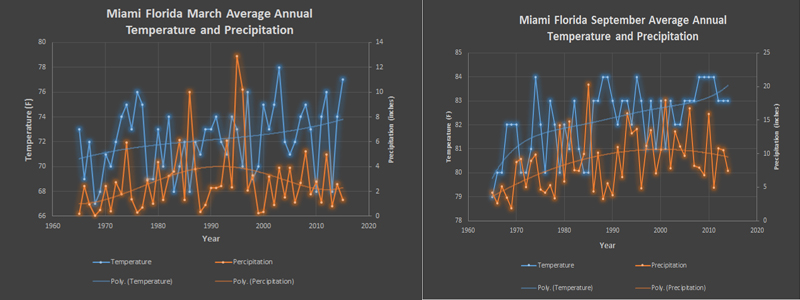
Fig. 13 - Miami, Florida, average March and September temperature and precipitation from 1965 to 2015.
Temperature locally at Anchorage for the month of March, Alaska Fig. 12 fell somewhat between 1976 and 2014 and slightly went up in those same years for the month of September, while the temperature in Miami Florida has risen for those same months of March and September, since 1976. This correlates to the local sea level for those areas. This is an extremely small example but one worth exploring to see if there is a direct correlation between local temperature and local sea level change and if so why. Locally precipitation at these locations does seem to follow a local pattern but these patterns seem to be different depending on location, latitude, longitude, time of year, etc. Understanding these patterns may help in planning for future agriculture, drinking water, etc. Although, overall global sea levels may be rising, understanding causes and variations on local sea levels seems to be important and worth further investigation. Local variations may help in modelling future sea level rise as well as future precipitation if the earth continues to warm.
References:
EPA.gov, 2015, Climate change indicators in the United States, http://www.epa.gov/climatechange/science/indicators/oceans/sea-level.html
Harris, R. 2013, Swinging CO2 levels show the earth is "breathing" more deeply, npr.org, http://www.npr.org/2013/08/08/210243967/swinging-co2-levels-show-the-earth-is-breathing-more-deeply
Lambeck, K., 2004, Sea level change through the last glacial cycle: geophysical, glaciological, and paleogeographic concequences, sciencedirect.com
nasa.gov, 2015, How is today's warming different from the past, Earth Observatory, http://earthobservatory.nasa.gov/Features/GlobalWarming/page3.php
Noaa, 2020, Weekly average CO2 at Mauno Loa, Global Monitoring Laboratory, https://www.esrl.noaa.gov/gmd/ccgg/trends/weekly.html
spaceweather.com, 2015, The Sunspot Number
ucar.edu, 2015, How much has the global temperature risen in the last 100 years?, University Corportation for Atmospheric Research, https://www2.ucar.edu/news/how-much-has-global-temperature-risen-last-100-years
Volker Quaschning, 2015, Development of global carbon dioxide emissions and concentration in atmosphere, http://www.volker-quaschning.de/datserv/CO2/index_e.php
Warwick,H., 2012, NSF Cheif scientist and engineer could have been more informative in her sea level paper, sea levels, http://www.warwickhughes.com/blog/?p=1750
Wikipedia, 2015, Ice age, https://en.wikipedia.org/wiki/Ice_age
Wikipedia, 2015, Sunspot, https://en.wikipedia.org/wiki/Sunspot
Wikipedia, 2015, Vostock Station, https://en.wikipedia.org/wiki/Vostok_Station
Woodford, Chris, 2014, Global Warming and Climate Change, explainthatstuff.com
Copyright © 2015-2022 averageglobaltemperature.com. All Rights Reserved.